About

Ahead of the Curve provides you with analysis and insight into today's global financial markets. The latest news and views from global stock, bond, commodity and FOREX markets are discussed. Rajveer Rawlin is a PhD and received his MBA in finance from the Cardiff Metropolitan University, Wales, UK. He is an avid market watcher having followed capital markets in the US and India since 1993. His research interests includes areas of Capital Markets, Banking, Investment Analysis and Portfolio Management and has over 20 years of experience in the above areas covering the US and Indian Markets. He has several publications in the above areas. The views expressed here are his own and should not be construed as advice to buy or sell securities.

Featured post

Time Series Analysis with GRETL

This video shows key time-series analyses techniques such as ARIMA, Granger Causality, Co-integration, and VECM performed via GRETL. Key dia...

Showing posts with label volatility. Show all posts

Friday 29 April 2022

Jaws GAP - India Vix vs US Vix

There is quite a bit of underperformance in Indian market volatility compared to US market volatility since the COVID-19 crash as indicated by the jaws gap below. This should resolve soon with an upcoming spike in Indian market volatility and a significant fall in the Nifty Index.


Thursday 16 August 2018

Why a Massive Selloff in Risk Assets Could be Just a Few Days Away?

First market breadth is diverging with the New 52 week high low indicator not confirming the recent retest of highs in the S and P 500:

S&P 500 vs S&P 500 Stocks at 52-Wk Highs Minus Lows (S&P 500 NH-NL)

High beta segment of the market such as the Nasdaq is beginning to under perform the broader market much like in 2000:

S&P 500 vs Nasdaq Relative to its 200-Day Moving Average (Nasdaq R200)

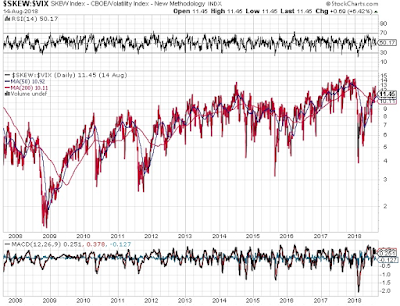
The Skew Vix ratio as shown on stockcharts has spiked into double digits recently suggesting high tail risk, which is often a precursor to rising volatility and a risk off trade set up:

skew vix ratio


All this as we are in the middle of an emerging market currency crisis much like in 1998 unsupported by a tightening FED:

Wednesday 7 February 2018

The Most Important Crowded Trade of All?

We have recently witnessed or are about to witness the implosion of a series of crowded trades namely long bitcoin, long Index ETF's and short volatility. The most important crowded trade of all is the dollar carry trade and this has been in vogue since the early 1980's. However the dollar appears to have broken out of its long term down trend line in the last 8 years post the great recession of 2008 though reluctantly so. When the real up move in the dollar occurs which is imminent look for massive carry trade liquidation and a rout in risky assets such as stocks, commodities and emerging market currencies:

Tuesday 19 December 2017

FED Balance Sheet Vs Emerging Market Volatility Vs Stock Market Capitalization to GDP

The assets on the FED balance sheet stands at well over 4.4 trillion dollars, this has coincided with record low emerging market volatility and highly inflated levels of stock market capitalization to GDP globally. With the FED beginning a slow tapering process, some sort of mean reversal is on the cards which could result in an uptick in emerging market volatility and a pull back of some sort in global stock market indices:

Thursday 23 November 2017

Indian Market Volatility Surging Relative to US Market Volatility

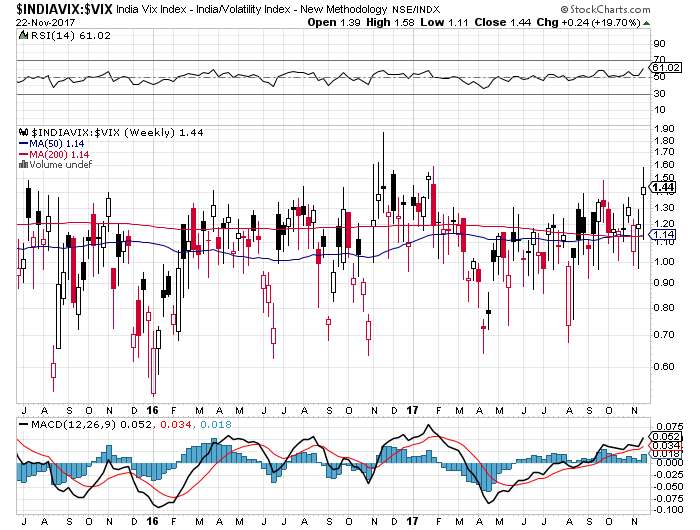
Indian market volatility has been surging off late relative to US market volatility much like in November 2016 when the last meaningful correction of 10% occurred. With the market close to record highs could complacency kill the cat yet again? Possible triggers - over valuation (p/e > 25), over bullish technicals, a slowing economy, you name it.

Visit StockCharts.com to see more great charts.

Wednesday 4 October 2017

Emerging Parallels to the Fall of 2007 - Hallmark of a Brand New Crisis

The fall of 2017 is increasingly looking like the fall of 2007 when risky assets topped out:

Monday 8 May 2017

The Case for a Sell in May and Go Away

Thursday 15 September 2016

Chart of the Week - Vix Futures CFTC Data

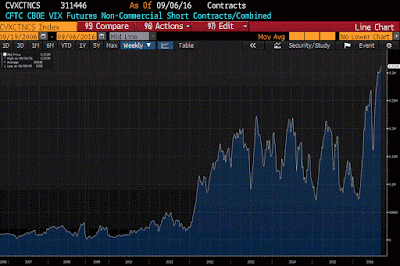
The chart of the week is courtesy the volatility surfer via seeking alpha and shows CFTC data on the Vix futures. Shorts on the Vix are at 10 year highs suggesting a high level of complacency in the market. This after the Vix has not made a new low on each of the recent new highs in the S and P 500 the last 2 years. Is volatility about to surge yet again in a seasonally week period for risk assets?

vix futures

Tuesday 15 March 2016

Dollar Strength to Return?

Yet another FED day has come and gone, the dollar has been trending down and is approaching oversold levels and could trigger a risk off trade near term, here's how to play this:

1) Dollar Strength:

The dollar is oversold and is likely to bounce from oversold levels and strengthen against the Euro: 

Can play this via the Ultralong Dollar ETF UUP: 

PowerShares DB US Dollar Bullish ETF (UUP)

 2) This should trigger a selloff in commodities like gold, oil and base metals which are overbought: 

Can play this via the ultra short basic materials ETF SMN: 

ProShares UltraShort Basic Materials (SMN)

 3) The Volatility picture remains complacent suggesting a surge in volatility post the fed. 

Can play it via the ultra long ETF on volatility UVXY: 

ProShares Ultra VIX Short-Term Futures (UVXY)

 4) This could trigger a selloff in stocks, with the S & P 500 breaking down out of a massive rising wedge on the long term charts courtesy stocktwits.com: 


 Can play this via ultra short ETF’s

5) Collapsing High Yield:

A high yield collapse is just around the corner and can be played via the ultra short ETF SJB:

ProShares Short High Yield (SJB)

Friday 1 January 2016

Predictions for 2016

Here are my predictions for 2016:


1) 2016 is finally the year when the Euro breaches parity to the Dollar:

EUR/USD (EURUSD=X)

2) 2016 will prove to be a year of significant under performance of risk assets, particularly global stock markets and emerging market currencies:

S&P 500 (^GSPC)
USD/INR (INR=X)

3) 2016 will prove to be the year where carry trades get liquidated as significant Yen strength resumes:

EUR/JPY (EURJPY=X)
AUD/JPY (AUDJPY=X)

4) Volatility surges in 2016 as global risk aversion increases significantly:

VOLATILITY S&P 500 (^VIX)

Thursday 31 December 2015

Update on Those Predictions for 2015

At the beginning of 2015 I made some predictions for grins. Here's how they played out:
The original post containing the predictions can be found here


1) Dollar strength continues after a brief pause against all major currencies except the yen. With the Euro decisively breaking the long term support of 1.20.
This indeed was the year of dollar strength with the Euro below 1.10 and the trend may continue well into 2016.

2) Yen strength should result in a bout of carry trade liquidation that is a major negative for risk assets such as emerging market currencies and commodities.
While the dollar was broadly strong against the yen, the Yen was relatively strong against most other majors and 2016 promised to be year of Yen strength. This year saw a massive down move in commodities as expected.

3) Despite slowing growth in most emerging economies, policy makers have their hands tied and spend a whole lot of resources defending their weak currencies unsuccessfully with higher interest rates.
Emerging market currencies saw major take downs ( The Real & Rand being notable examples) across the board and the trend is set to continue in 2016.

4) This in turn sparks a major exodus of FII money flows out of emerging economies like the BRIC countries which causes their stock markets to significantly under perform despite their terrific performance in 2014 and greedy analysts calls for more.
BRIC stock markets under performed significantly in 2015 except China and more weakness is likely in 2016.

5) Volatility surges in 2015 as the Vix index doubles following a major take down of stock market indices across the globe.
The Vix crossed 50 briefly in August before retreating. A big up move in the Vix is likely in 2016.

6) Risk free assets will be among the safer bets in 2015 as risk appetites significantly wanes with treasury yields continuing to plummet with QE forever still continuing but without the desired outcomes.
Risk free assets outperformed risky assets globally but US long term yields rose as the FED began tightening Monetary policy. Risky free assets will continue to outperform in 2016.

Happy New Year!

Monday 7 December 2015

Head Winds for Global Financial Markets Going Forward

1) Collapsing Oil:

Oil has entered into a free fall post OPEC and is not looking to stabilize anytime soon. This has deflationary implications:

2) A Weak High Yield Market:

Collapsing oil is definitely creating trouble for high yield issuers in the Oil market. Rig counts have almost halved and the high yield ETF is at a 52 week low. While default rates are still below long term averages there could be trouble ahead:
SPDR Barclays High Yield Bond ETF (JNK)

3) Diverging Transports:

Collapsing oil should logically help the transports but this has not been the case and transports have significantly diverged from the S and P 500 with no new highs in the transports in over a year:

4) Volatility on the Up:

The Vix has also positively diverged not making new lows in each of the markets recent up moves in over a year and a half:

Tuesday 16 June 2015

Trading Strategies for Fed Day and Beyond

The Fed's first rate hike is still far away. Several key asset classes could head lower post the #Fed despite the FOMC affirming  a dovish outlook. Markets have been breaking down recently and the bearish trend could resume post the #FOMC. Let us look at some key markets:
Hottest Deals On Refurbished Apple Products | JemJem

S& P 500
Current: 1958
Support: 
Recent Lows – 1867
Resistance: 
Recent Highs - 2021
The 50 Day Moving Average (DMA) – 2041
Outlook: Bearish
Long: 1950 Put
Hedge : 1980 Call

Euro:

Current: 1.130
Support: 
50 Day Moving Average (DMA) – 1.1108
Resistance: 
50 Day Weekly Moving Average (DMA) – 1.1464
Outlook: Bearish
Long: 1.12 Put
Hedge : 1.14 Call

Gold ETF GLD:
SPDR Gold Shares (GLD)
Current: 109.21
Support: 
50 DMA – 107.29
Resistance: 
20 WMA – 110.44
Outlook: Bullish
Long: 110 Call
Hedge : 108 Put

Oil ETF USO:
United States Oil ETF (USO)
Current: 14.62
Support:
20 DMA - 14.48
Resistance : 
50 DMA – 15.24
20 WMA - 17.43
Outlook: Bearish
Long: 14.5 Put
Hedge : 15.5 Call

Nifty:
Current: 7981
Support: 
Monthly lows – 7553
Resistance: 
Recent Highs – 8091
Outlook: Bearish
Long: 7800 Put
Hedge : 8100 Call

Thursday 14 May 2015

Rounding Top Pattern in the Indian Stock Market Nifty Index Suggests Lower levels for the Nifty in the Months Ahead

The weekly chart of the Indian stock market Nifty index shows a rounding top formation that targets 6000 on the Index. This coincides with a rounding bottom that is forming on the weekly chart in the India Vix which is a measure of Indian stock market volatility suggesting an upsurge in volatility in the upcoming months. The pattern suggests a level of 35 for the India #Vix up over 50% from current levels. This implies significant downside for the Nifty in the upcoming months.
Incidentally the India Vix has traded below the US Vix recently and a catch up to the upside is likely as the India Vix tends to be significantly higher than the US Vix.


Friday 2 January 2015

Predictions for 2015

Dollar strength continues after a brief pause against all major currencies except the yen. With the Euro decisively breaking the long term support of 1.20.
EUR/USD (EURUSD=X)
GBP/USD (GBPUSD=X)

Yen strength should result in a bout of carry trade liquidation that is a major negative for risk assets such as emerging market currencies and commodities.
AUD/JPY (AUDJPY=X)
INR/JPY (INRJPY=X)
SPDR Gold Shares (GLD)
Despite slowing growth in most emerging economies, policy makers have their hands tied and spend a whole lot of resources defending their weak currencies unsuccessfully with higher interest rates.
USD/RUB (RUB=X)

This in turn sparks a major exodus of FII money flows out of emerging economies like the BRIC countries which causes their stock markets to significantly under perform despite their terrific performance in 2014 and greedy analysts calls for more.
CNX NIFTY (^NSEI)
IBOVESPA    - (^BVSP)
SHANGHAI COMPOSITE INDEX ETF UN (510210.SS)
Volatility surges in 2015 as the Vix index doubles following a major take down of stock market indices across the globe.
VOLATILITY S&P 500 (^VIX)
Risk free assets will be among the safer bets in 2015 as risk appetites significantly wanes with treasury yields continuing to plummet with QE forever still continuing but without the desired outcomes.
CBOE Interest Rate 10 Year T No (^TNX)
Treasury Yield 30 Years (^TYX)

Stock Market News

Amazon Deals

World Indices


Live World Indices are powered by Investing.com

Market Insight

My Favorite Books

  • The Intelligent Investor
  • Liars Poker
  • One up on Wall Street
  • Beating the Street
  • Remniscience of a stock operator

See Our Pins

Trading Ideas

Forex Insight

Economic Calendar

Economic Calendar >> Add to your site

India Market Insight

My Asset Allocation Strategy (Indian Market)

Cash - 40%
Bonds - 20%
Fixed deposit - 20%
Gold - 5%
Stocks - 10% ( Majority of this in dividend funds)
Other Asset Classes - 5%

My belief is that stocks are relatively overvalued compared to bonds and attractive buying opportunities can come along after 1-2 years. In a deflationary scenario no asset class does well other than U.S bonds, the U.S dollar and the Japanese yen, so better to be safe than sorry with high quality government bonds and fixed deposits. Cash is the king always. Of course this varies with the person's age.