Indicator
|
Weekly
Level / Change / Significance
|
Implication
for
S
& P 500
|
Implication
for Nifty*
|
S
& P 500
|
2090, 0.05%
|
Neutral
|
Neutral
|
Nifty
|
7943, 1.10%
|
Neutral**
|
Bullish
|
China
Shanghai Index
|
3436, -5.35%
|
Bearish
|
Bearish
|
Gold
|
1056, -1.91%
|
Bearish
|
Bearish
|
WTIC
Crude
|
41.77, 0.75%
|
Bullish
|
Bullish
|
Copper
|
2.05, 0.69%
|
Bullish
|
Bullish
|
Baltic
Dry Index
|
581, 16.67%
|
Bullish
|
Bullish
|
Euro
|
1.0595, -0.50%
|
Bearish
|
Bearish
|
Dollar/Yen
|
122.83, 0.06%
|
Neutral
|
Neutral
|
Dow
Transports
|
8215, -1.04%
|
Bearish
|
Bearish
|
US
10 year Bond Yield
|
2.23%, -1.64%
|
Bullish
|
Bullish
|
Nyse
Summation Index
|
253, 32.59%
|
Bullish
|
Neutral
|
US
Vix
|
15.12, -2.26%
|
Bullish
|
Bullish
|
20
DMA, S and P 500
|
2081, Above
|
Bullish
|
Neutral
|
50
DMA, S and P 500
|
2029, Above
|
Bullish
|
Neutral
|
200
DMA, S and P 500
|
2065, Above
|
Bullish
|
Neutral
|
20
DMA, Nifty
|
7905, Above
|
Neutral
|
Bullish
|
50
DMA, Nifty
|
7997, Below
|
Neutral
|
Bearish
|
200
DMA, Nifty
|
8306, Below
|
Neutral
|
Bearish
|
India
Vix
|
16.73, 5.24%
|
Neutral
|
Bearish
|
Dollar/Rupee
|
66.91, 1.21%
|
Neutral
|
Bearish
|
Overall
|
S
& P 500
|
Nifty
|
|
Bullish
Indications
|
9
|
7
|
|
Bearish
Indications
|
4
|
8
|
|
Outlook
|
Bullish
|
Bearish
|
|
Observation
|
The
Sand P 500 and the Nifty were up last week. Indicators are bullish. Markets
are back at resistance and the Vix is signaling complacency. A major break
out is likely this week.
|
|
|
On
the Horizon
|
Australia
- Rate decision, Canada - Rate decision, Swiss – Retail sales, Euro zone –
German employment data, CPI & PPI, ECB rate decision, U.S – employment
data, India – Rate decision, GDP.
|
|
|
|
|
|
|
*Nifty
|
India’s
Benchmark Stock Market Index
|
|
|
Raw
Data
|
Courtesy
Google finance, Stock charts, FXCM
|
|
|
**Neutral
|
Changes less than 0.5% are considered
neutral
|
|
|
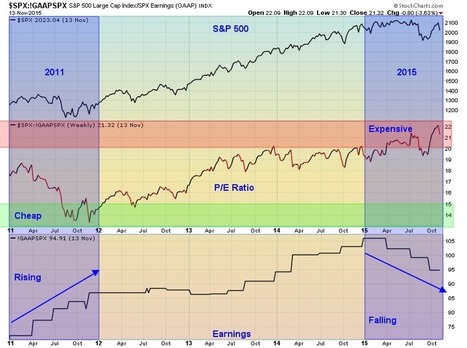
The US
market was up slightly and the Nifty rallied last week. Signals are mixed for
the upcoming week. The markets are back at resistance and are likely to correct
with most emerging markets, and commodities already breaking down on a strong
dollar and a hawkish FED. The critical levels to watch are 2100 (up) and
2065 (down) on the S & P and 8000 (up) and 7800 (down) on the Nifty. A
significant breach of the above levels could trigger the next big move in the above
markets. You can check out last week’s report for a comparison. You can also check out snapshots of
the S and P 500 and Nifty Indices. Love your thoughts and feedback.
"Interestingly, based simply on correlations the current market fits very closely with that of 1937."
Benzinga Ahead Of Black Friday, Enthusiasm For Retail ETFs Wanes MarketWatch XRT, the largest dedicated retail ETF, has shed 5 percent over the past week and more than 6 percent over the past month, giving traders and investors good reason to mull..."
3) 3 reasons to be bullish on gold in 2016 - Financial Post
Gold prices recently hit yet another five-year low, but HSBC is calling for a bounce back in 2016"
By Rob BennettI often make the claim that it is a terrible mistake for buy-and-holders not to take valuations into consideration when setting their stock allocations, because the peer-reviewed research..."
The covered combination is a great options strategy for moderately bullish investors who are willing to sell their stock or buy more at the right price."
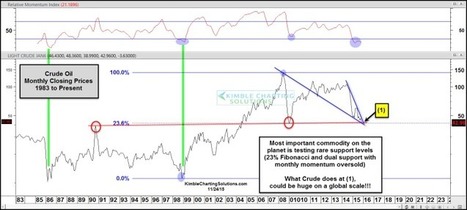
Crude Oil is quite simply the most important commodity on the planet. And crude oil prices are currently as oversold as they were at the 1999 low."
Market Insight
-
U.S. Birth Rate Drops To New Low After Pandemic ‘Baby Bump’
-
There were nearly 3.6 million births recorded in the U.S last year, a drop
of 2% from 2022.
25 minutes ago
-
-
Allspring Global Investments Holdings LLC Decreases Stock Holdings in FTAI
Aviation Ltd. (NYSE:FTAI)
-
Allspring Global Investments Holdings LLC cut its stake in FTAI Aviation
Ltd. (NYSE:FTAI – Free Report) by 11.4% in the fourth quarter, according to
the co...
1 hour ago
-
Debt Rattle April 25 2024
-
Amedeo Modigliani Nu allongé 1917 • US Sided With Evil And Fascism –
Russian Envoy (RT) • Alvin Bragg Has His Trump Trial, All He Needs Now Is A
Crime ...
1 hour ago
-
Mark Zuckerberg Shifts Meta's Focus To AI 'Agents' Over Chatbots: Apple To
Pursue Similar 'Holy Grail,' Predicts Gene Munster
-
Zuckerberg, during Meta's Q1 2024 Earnings Call, discussed the future of
AI, emphasizing the transition from chatbots to AI agents. He explained
that the...
3 hours ago
-
Russia Responds Precisely on Target
-
Nearly $300 billion worth of confiscated frozen Russian assets have been
set to the side by the West. Some of the world’s leading decision-makers
have been...
5 hours ago
-
Iran Claims Property Rights in Antarctica | Navy Commander Shahram Irani
-
The Antarctic Treaty was signed in 1959 by twelve countries prohibiting
those nations from testing weapons or constructing military bases on the
South Pola...
11 hours ago
-
Why Are There So Many Americans That Can’t Find A Job Even Though They Are
Desperate To Be Hired?
-
According to the absurd numbers that the government feeds us, the
unemployment rate is very low and there are lots of jobs available. But if
what they a...
13 hours ago
-
S&P 500 PE Ratio
-
*Current S&P 500 PE Ratio:* 27.53 +0.01 (0.02%)
4:00 PM EDT, Wed Apr 24
14 hours ago
-
Boeing: Better-Than-Expected Earnings... But Still a Long Way to Go Down
-
Boeing: Better-Than-Expected Earnings... But Still a Long Way to Go Down
Boeing (BA) delivered their quarterly earnings report to the market this
morning a...
15 hours ago
-
Wednesday links: the shelf life of a stock
-
Banking
- The number of bank branches in the U.S. peaked in 2012. (sherwood.news)
- Where SVB's business stands as JP Morgan ($JPM) looks to make i...
16 hours ago
-
At The Money: Bill McBride on What Data Matters and What Doesn’t
-
At the Money: What Data Matters and What Doesn’t (April 24, 2024)
Bill McBride has spent the past 20 years taking apart economic data,
creating “o...
21 hours ago
-
The Freedom Issue: Let’s be Sober and Proactive
-
Many years we have seen the civil liberty – the basis of classical
liberalism – is being under attack by populism, nationalism and
authoritarianism. This h...
22 hours ago
-
Better Than Finding the Next NVIDIA
-
While investors are looking for the next NVIDIA, Mike Carr found a smarter
way to expedite wealth with a special type of short-term trades.
The post Bett...
23 hours ago
-
Daily Market Brief
-
Subscriber content. To subscribe to the Daily Market Brief please visit
Market Services on NorthmanTrader.com. The Daily Market Brief is an
in-depth market...
1 day ago
-
Cities' "Doom Loops" Are Even Worse Than You Imagined
-
*This is why those who understand these dynamics are getting out, even
though the city was their home. *
*A correspondent who prefers to remain anonymous ...
1 day ago
-
Bank Holidays on 1st of May 2024
-
A large number of countries including many EU member states and the UK
celebrate bank holidays on Monday 1st of May 2024. Please beware of market
closure...
1 day ago
-
-
Top China Stock Picks to Buy Amid Economic Boom
-
China's economy surged beyond projections at the start of 2024, with the
Gross Domestic Product (GDP) escalating by 5.3% in the first quarter, an
increase ...
2 days ago
-
State revenue from death and gift taxes : One of these things is not so
certain anymore
-
Estate taxes are commonly called “death taxes” because they’re levied on
the value of everything you own at the time of death. Only estates valued
above a ...
2 days ago
-
Long Awaited
-
Weekly report covering Gold, Equities, Crude, Dollar. A look at trade
opportunities and covering the model portfolio.
The post Long Awaited appeared firs...
4 days ago
-
Total Number of Stocks Is Shrinking
-
[image: total number of nyse nasdaq issues traded]
The major averages may still be trending higher, but the total numbers of
issues traded on the NYSE an...
6 days ago
-
Unveiling the Golden Opportunity: Maximizing Profits with GLD
-
Are you ready to seize the golden opportunity in trading? In our last
analysis, we forecasted a monumental breakout in the gold market, and the
results h...
2 weeks ago
-
Weekend Update - Trendline rejection (3/8/24)
-
SPX was rejected by the blue trendline Friday. The trendline had been
sucessfully tested four times and held since November, until now. SPX has
unable ...
1 month ago
-
Catastrophic Risk: Investing and Business Implications
-
In the context of valuing companies, and sharing those valuations, I do
get suggestions from readers on companies that I should value next. While I
d...
2 months ago
-
Hello world!
-
Welcome to WordPress. This is your first post. Edit or delete it, then
start writing!
2 months ago
-
Teaching Johns Hopkins A Privilege Lesson
-
by Not Sure01/12/24Johns Hopkins Hospital Chief Diversity Officer Sherita
Hill Golden sent a letter out essentially implying that all people who
don’t look...
3 months ago
-
Mungerisms: Timeless Wisdom from Charlie Munger on Life and Business
-
"Mungerisms" are succinct expressions of wisdom and insights coined by
Charlie Munger, the Vice Chairman of Berkshire Hathaway and Warren
Buffett's longtim...
4 months ago
-
If You Find Deer or Elk Antlers on the Ground, Leave Them There, Say Some
States
-
Even though elk do shed their antlers naturally, collecting them brings up
a number of ethical issues.
6 months ago
-
It’s Crunch Time for The Daily Doom and Doom Time for The Great Recession
Blog
-
The Great Recession Blog is officially done for good, and it remains to be
seen if all my writing continues on TheDailyDoom.com. If my writing on
economi...
9 months ago
-
Innovative Industrial Properties Stock a Great Way to Play Pot Sector
-
*IIPR Stock Represents a Long-Term Opportunity*
Marijuana stocks briefly attracted investors' attention following the 2022
mid-term elections, when Maryl...
1 year ago
-
2008 analogue
-
The 2008 analogue tape looks very interesting from where we stand.
Let's anchor it to the next two Fed meetings -- since that's all that
matters -- and i...
1 year ago
-
Back to trade with Bar Replay
-
It is often said that one should not be sad about the past, but sometimes
it can be nice to return to it. Who would like to buy Tesla for $1 and
experience...
1 year ago
-
After This Holiday Rally, You Better Know When To Walk Away
-
This week’s investor insight will make you think twice about the current
stock and bond rally as we head into the end of the year. We get a lot of
questi...
1 year ago
-
How Africa Can Escape Chronic Food Insecurity Amid Climate Change
-
The toll of extreme weather events on crops underscores the region’s
challenges and need for policies to save lives and protect livelihoods.
1 year ago
-
12 Bear Market Rules To Live By – Survive & Thrive In The Next Bear Market
-
12 Bear Market Rules To Live By – Survive & Thrive In The Next Bear Market
[image: Bear Market Rules Survival Guide]
I grew up in the 1970s-1980s when th...
1 year ago
-
Growth Companies – Getting What You Want
-
What do the growth companies in your field have in common? How are they
doing so well and what can you learn from them? Growth companies usually
make a pro...
1 year ago
-
-
Blog Post Title
-
What goes into a blog post? Helpful, industry-specific content that: 1)
gives readers a useful takeaway, and 2) shows you’re an industry expert.
Use your c...
2 years ago
-
Foot Locker Crushed Q2 Earnings Expectations Sending Stock Higher
-
Plus, AstraZeneca said its antibody therapy reduced the risk of developing
COVID-19 symptoms by 77%, The Topps Co’s SPAC merger is off, and Elon Musk
annou...
2 years ago
-
Elliott Wave Stock Market Update - July 10th
-
The market has continued its rally to higher highs and it doesn't seem like
it wants to stop. We now have a new ATH at 4371 which are NASDAQ levels
s...
2 years ago
-
The Psychology of QE is Far More Important Than the Amount of It
-
Let's discuss what QE really does vs the psychology of QE.
2 years ago
-
Hello world!
-
Welcome to WordPress. This is your first post. Edit or delete it, then
start writing!
3 years ago
-
Trading: Opportunities Are Dispersed
-
Opportunities are dispersed. You might have an... *READ THE REST OF THE
ARTICLE ON THE NEW WEBSITE: JIM ROGERS TALKS MARKETS *
*Jim Rogers is a legendary i...
3 years ago
-
Market Signals for the US stock market S and P 500 Index and Indian Stock
Market Nifty Index for the Week beginning November 09
-
Indicator Weekly Level / Change Implication for S & P 500 Implication for
Nifty* S & P 500 3509, 7.32% Bullish Bullish Nifty 12264, 5.34% Neutral **
Bullis...
3 years ago
-
-
Fully Automated Trend Trading w/ Stocks Or Options
-
There’s a lot of research to support the usage of trend indicators as
simple risk reduction elements that can be layered onto an existing
strategy. Howev...
3 years ago
-
2020 Top Investment Picks – Q3 Update
-
At the beginning of the year, I put together a list of Top Investment Picks
for 2020 from the investment community and track them on this website. This
is ...
3 years ago
-
Upside-Down Markets: Profits, Inflation and Equity Valuation in Fiscal
Policy Regimes
-
I just published a new long-form piece through OSAM entitled “Upside-Down
Markets: Profits, Inflation and Equity Valuation in Fiscal Policy Regimes.”
In th...
3 years ago
-
The last of 12326
-
February 22nd 2012.....
First post...
https://permabeardoomster.blogspot.com/2012/02/can-anyone-fly-plane.html
--
This post will be the last under the o...
3 years ago
-
-
6/7 to 10/7, 2020 Nifty & Bank Nifty, Bharat Forge, IBhasgFin & RIL.
Weekly futures Pr...
3 years ago
-
Ultramarathoner Runs Over 200 Miles in Backyard, Wins Golden Toilet Paper
Roll
-
Strange times indeed. In the land “BC,” before coronavirus, people ran long
distances in foot races, and toilet paper wasn’t coveted. Things have
changed. ...
4 years ago
-
One Year Later
-
A year ago today I lost my father and my best friend, everyone here lost
their mentor and a friend. Dad and I spent the last 7 years of his life
living tog...
4 years ago
-
-
Advanced Micro Devices (AMD) Retreating Towards Key Support Around
$25.60-$27
-
AMD has failed to clear the
2018 high around $34.20. It is retreating, and has broken an
August/September sup...
4 years ago
-
Advanced Search is Now on Stocktwits
-
Advanced Search Is Now on Stocktwits
Come rain or shine, the Stocktwits community shares over 200,000 messages
per day. That includes charts, news, trade i...
4 years ago
-
Nightly Algo Report – December 6, 2018
-
To access this post, you must purchase Premium Plan or Premium Plan -
Annual.
The post Nightly Algo Report – December 6, 2018 appeared first on
Elliottwa...
5 years ago
-
Don’t be Fooled by the Pullback in the Dollar Because….
-
Don’t be fooled by the pullback in the U.S. dollar today because the
greenback could still strengthen further before the end of the year. Nearly
all of the...
5 years ago
-
A look at the bull market ahead
-
My latest missive on the near-term stock market outlook can be seen at
Financial Sense web site. You can see it by clicking on the following link:
https:/...
6 years ago
-
Weekly Videos
-
This week’s video will be posted on the new home for Short Takes. If all
goes well, it will appear sometime between 6:00 and 8:00 pm ET.
6 years ago
-
Gold Miners near a buy zone
-
Gold cleared a several month long consolidation a few weeks ago as it
cleared $1300, and has since been consolidating as it drifts back to […]
The post G...
6 years ago
-
Current Account Deficits and Safe Assets
-
The International Monetary Fund has issued its External Sector Report for
2017, and among its key findings: “Global current account imbalances were
broadly...
6 years ago
-
Kafka For The Twenty First Century
-
I've been spending a slightly frustrating day trying to update my payment
details at google. To log in to my admin console I need to log in using my
G Sui...
7 years ago
-
Gold Unleashed by Fed
-
Gold's next major upleg was likely unleashed by a very-dovish FOMC this
week, which now has its hands tied on hiking rates or being hawkish due to
the US e...
7 years ago
-
August 24th Blogger Sentiment Poll
-
There are more bulls than bears in this week's poll. Blogger Sentiment Poll
Participants: 24/7 Wall St (N) Carl Futia (+) Dash of Insight (+) Elliot
Wave L...
14 years ago
My Favorite Books
- The Intelligent Investor
- Liars Poker
- One up on Wall Street
- Beating the Street
- Remniscience of a stock operator
India Market Insight
-
NIfty 25 April 2024 Monthly Expiry Analysis
-
Foreign Institutional Investors (FIIs) displayed a Bearish approach in the
Nifty Index Futures market by Shorting 20779 contracts worth 2337 crores,
res...
6 hours ago
-
Tata Elxsi Q4 net profit, revenue decline QoQ; firm declares dividend of Rs
70 per share
-
[image: Tata Elxsi Q4 net profit, revenue decline QoQ; firm declares
dividend of Rs 70 per share] The net profit was down 4.6 percent
quarter-on-quarter co...
1 day ago
-
Rupee falls 29 paise to close at 82.68 against US dollar
-
During the day, the rupee touched a high of 82.45 and a low of 82.68
against the greenback. On Friday, the rupee had settled at 82.39 against
the dollar.
10 months ago
-
-
ES Hourly cloud and 4 Hour chart
-
- ES Hour moving towards the hourly cloud which may act as resistance.
- 4 Hour chart shows a possible bullish candle which may give new high's
...
2 years ago
-
JUST NIFTY BLOG 10-01-2020
-
Bulk Deals FII DII Stats Date # of Deals Total Volume (In Millions)
01-01-1970 0 0.00 Click here to see all Bulk Deals Date Category Buy Amount
(Rs. Cror...
4 years ago
-
Vist Note on Federal Bank
-
We recently met the senior management of Federal Bank which is one of the
old private sector banks with a distribution network of 1252 branches (48%
Kerala...
6 years ago
-
Nifty Bulls bounces ferociously holding 9930,EOD Analysis
-
FII's bought 4.8 K contract of Index Future worth 262 cores ,9.7 K Long
contract were added by FII's and 4.8 K Short contracts were added by FII's.
Net Ope...
6 years ago
-
Midcap & Smallcap Index Corrects, Lets Come Back To Fundamentals Again
-
Midcap Index had made a high of 18511 on 16th May 2017, fell almost 7% and
is currently trading at 17230. Smallcap Index made all time high of 7679 on
11th...
6 years ago
-
Market outlook for 30/10/2016
-
*Nifty closed up 22.75 points (0.26%) at 8638.00* while Future closed at
8667.40, premium of 29.40 points.
*Bank Nifty closed up 41.35 points (0.21%) at 19...
7 years ago
-
Option Open Interest for 28-10-2016
-
Inference The index opened flat to positive and after making an initial low
around 8581 saw some short covering to close at 8638.00, gain of 22.75
points. ...
7 years ago
-
Market Review for 23rd August 2016
-
*Nifty (8629)* we said ‘technically trend is still intact but there exists
selling pressure near 8746 and support around 8600 zones’ the Nifty
unfolded as...
7 years ago
-
ITC To Resume Cigarette Manufacturing
-
ITC manufactures a range of cigarette brands, including India Kings,
Classic, Gold Flake, Navy Cut, Capstan, Bristol, Flake, Silk Cut, which are
manufactur...
8 years ago
-
My Asset Allocation Strategy (Indian Market)
Cash - 40%
Bonds - 20%
Fixed deposit - 20%
Gold - 5%
Stocks - 10% ( Majority of this in dividend funds)
Other Asset Classes - 5%
My belief is that stocks are relatively overvalued compared to bonds and attractive buying opportunities can come along after 1-2 years. In a deflationary scenario no asset class does well other than U.S bonds, the U.S dollar and the Japanese yen, so better to be safe than sorry with high quality government bonds and fixed deposits. Cash is the king always. Of course this varies with the person's age.